As you have known, you must know what the capacity of a fan is before you consider opening a damper or increasing the fan speed. Doing so may not be safe—it could result in an overloaded motor, for example, or an unusually high power consumption—so you should be able to predict the results of any changes you may decide to make. Fan and blower manufacturers provide important information about their products in the form of performance curves. A performance curve is a graph that represents a fan’s volume flow rate (along the horizontal axis), plotted against either the horsepower required or the static pressure (along the vertical axis). Figure 1 shows typical performance curves for two forward-curved centrifugal fans.
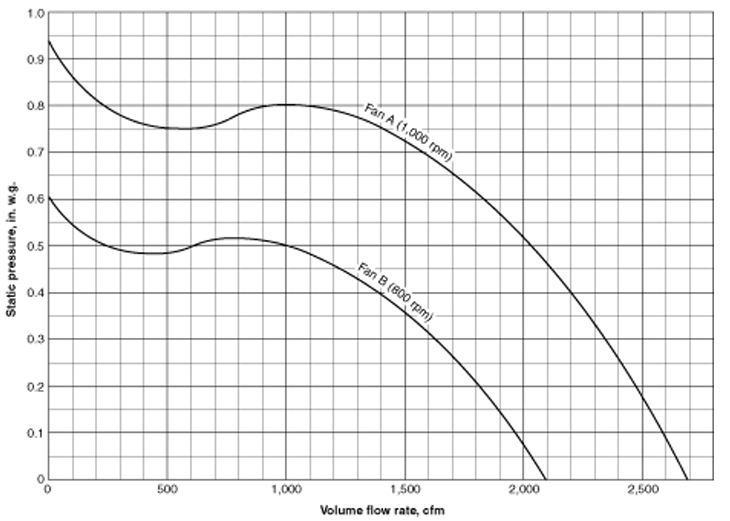
the ductwork is entirely closed off. By the time the air flow has reached 500 cfm, the static pressure has dropped nearly 0.2 in. w.g. This is because registers are being opened to allow air to flow through the system. The lowered resistance means a lower static pressure and a higher volume flow rate.
Between about 500 and 1,000 cfm, the static pressure temporarily rises as the air flow continues to increase. This is known as the “unstable” portion of a fan performance curve. Then, after reaching a second high point of 0.8 in. w.g. at about 1,000 cfm, the static pressure begins to drop and continues to drop as the system gradually opens. When the static pressure reaches 0 (at the bottom of the graph), all restrictions have been removed. When there are no restrictions to air flow and no static pressure, a fan is said to be in a state of free delivery.
The bottom curve in Figure 1 plots the performance of a smaller fan rated at 800 rpm. Note that the two curves have the same shape. This is because Fan A and Fan B are geometrically similar. Fans that are geometrically similar—that is, all of their wheel dimensions have the same proportionate ratios—produce performance curves with the same shape. (Of course, the two curves also could represent the same fan operating at two different speeds.) Remember that a system’s design characteristics, as represented by its parabolic curve, are independent of the fan used in that system. If a system characteristic curve and a fan performance curve are plotted on the same graph, the two curves will intersect. The point at which they intersect is called the point of operation. The point of operation tells you the cfm and the corresponding static pressure that you can expect for that particular fan operating in that particular system.
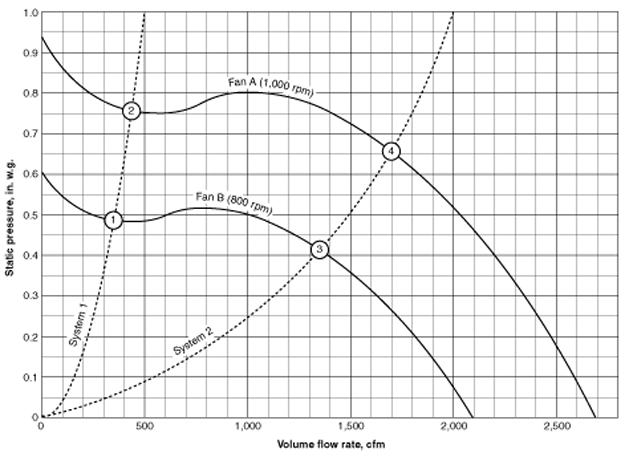
Figure 2 shows the two fan performance curves from Figure 1 (Fan A and Fan B) plotted on the same graph with two system characteristic curves (the dashed lines labeled “System 1” and “System 2”). This produces four points of operation (the numbered circles 1, 2, 3, and 4). Ideally, the point of operation should fall between the pressure “peak” and free delivery, on the right-hand slope of the fan performance curve. Selecting a fan with a point of operation in the “unstable” portion of the curve (to the left of the pressure peak) may result in “hunting” and noisy operation. As you can see from the location of the points of operation in Figure 2 below, neither Fan A nor Fan B would work well in System 1. Both fans would be more suitable for operation in System 2.
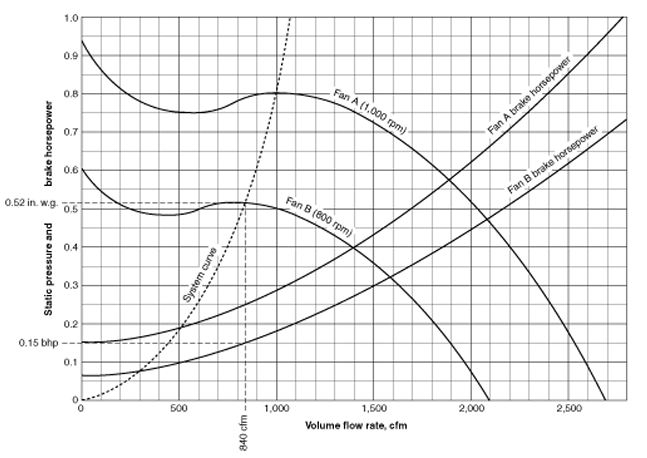
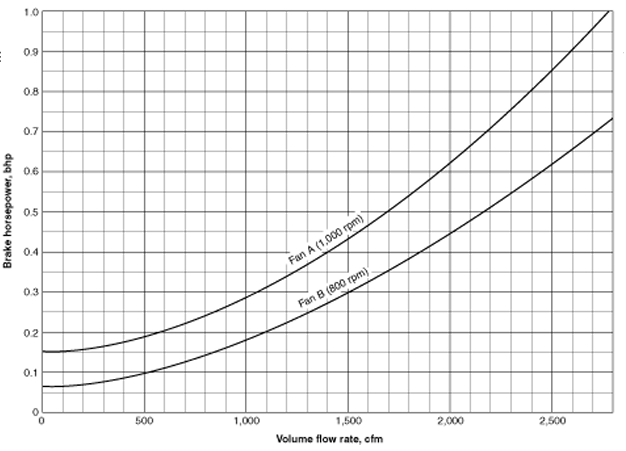
Sometimes fan performance curves are plotted to show brake horsepower along the vertical axis, instead of static pressure. Figure 3 below shows brake horsepower curves for both Fan A and Fan B. Figure 4 shows the same graph with the brake horsepower curves superimposed over the original fan performance curves. Note that brake horsepower and static pressure share the same axis. This is frequently done to conserve space. Figure 4 also includes a system characteristic curve. What can you learn from this graph? You can tell, for example, that if Fan B, operating at 800 rpm, is installed in this particular fan system, a volume f low rate of 840 cfm and a static pressure of 0.52 in. w.g. can be expected. Now follow the 840-cfm line straight down until it crosses the brake horsepower curve for Fan B. From the point of intersection, follow a horizontal line to the left to meet the brake horsepower scale. You will find that 0.15 hp will be required to drive Fan B in this application.
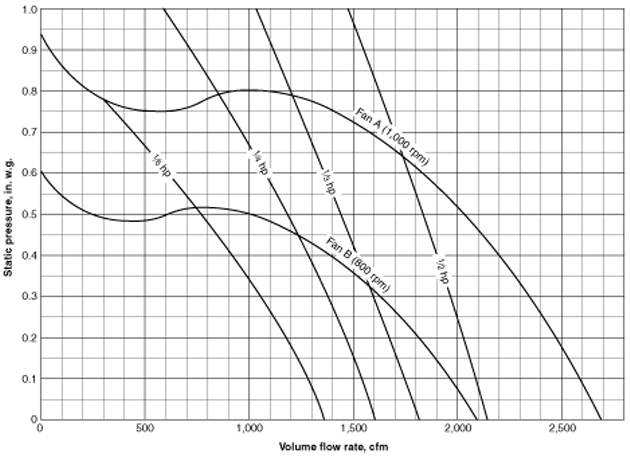
On some graphs, selected horsepowers are plotted as shown in Figure 5. This eliminates the need for a horsepower scale. The points of intersection indicate the performance of a particular fan when driven by a motor operating at the given horsepower. Another alternative method of graphing fan performance plots fan speed (rpm) along the vertical axis, instead of static pressure. Selected static pressure values are represented by the individual performance curves. An advantageous feature of this type of graph is that system resistances are drawn as straight lines, instead of curves.
Regardless of how fan performance is represented, it is important to realize that fans are tested and rated under strictly controlled conditions. Fan performance data are generally based on dry air at “standard” conditions–14.696 psi and 70°F (0.075 lb/ft3). However, when a fan is installed in a working system, it may be required to handle air at some other density. Restrictions at either the inlet or the discharge of the centrifugal fan also can affect its performance–and, as you know, when one variable changes, all the others change. Likewise, system characteristic curves are based on design conditions. But filters soon begin to load with dirt, coils start condensing moisture, and the positions of dampers are changed. If the actual system resistance is not the same as the design system resistance, the system curve changes. This means that the point of operation along the fan’s performance curve also changes, and the static pressure and volume delivered will not be as calculated. When these variations from “ideal” conditions occur, the fan laws will help you calculate new values.
Related Posts:
The fans are tested for field performance by measurement of flow, head, temperature on the fan side and electrical motor kW input on the motor side.
Air flow measurement…
Introduction
This document contains introductory material designed to familiarize the user with the conventions and terminology related to fan curves….
